notes.husk.org/likes
images.
similar to
21209512502
.
24 images, most alike first.
chart
The Economist
world cup
graphs
Blue Lines Revisited
electricity consumption growth
global energy trends
energy demand projections
distributed power
world map
electricity usage
energy growth
asia energy trends
africa energy trends
energy consumption map
BruceS
algorithms
hospitals
hospital bill
#algopop
life expectancy
health spending
scatter plot
public health
healthcare economics
data visualization
global health
correlation
healthcare costs
statistical graph
BruceS
median income
age groups
economic trends
income inequality
demographics
income growth
income decline
economics
data visualization
STML
reading habits
global reading statistics
literature genres
data visualization
reading demographics
world map
book preferences
literacy trends
reading culture
Notational
railway electrification
uk rail infrastructure
germany rail infrastructure
comparative data
transport trends
railway statistics
infrastructure development
historical rail data
european rail networks
data visualization
psd
data visualization
chart
trends
statistics
time series
monthly data
data analysis
metrics
comparison
Blue Lines Revisited
3 images
photo
cartoon
map
chart
the economist
europe
social democracy
centre left
politics
The Economist
BruceS
2 images
chart
The Economist
military targets
satellite imagery resolution
remote sensing
military surveillance
spatial resolution
geospatial intelligence
target detection
imagery analysis
defense technology
intelligence gathering
One Visible Future
surveillance
data interception
privacy
metadata
government monitoring
communications data
digital privacy
statistics
global surveillance
law enforcement
Dan W, Software Developer
shipping industry
maritime logistics
container capacity
teu
shipping alliances
bar chart
global trade
data visualization
maritime
logistics data
Dan W, Software Developer
chart
The Economist
more cheerful than they look
BruceS
science communication
public opinion
scientific literacy
data visualization
climate change
biotechnology
energy policy
pew research center
biomedical science
social science
cosmic
dating trends
race and ethnicity
gender dynamics
data visualization
interracial dating
social statistics
demographic data
relationship studies
dating app statistics
rachelbinx
sankey diagram
energy consumption
us energy use
energy sources
renewable energy
fossil fuels
electricity generation
data visualization
energy statistics
energy efficiency
twaltari
llama population
usa map
choropleth map
usda agricultural census
livestock distribution
data visualization
us counties
agricultural statistics
animal demographics
us geography
Dan W, Software Developer
microbiome
phylogenetic tree
microbiology
human microbiota
cladogram
data visualization
bacteria
archaea
microbial distribution
what what.
4 images
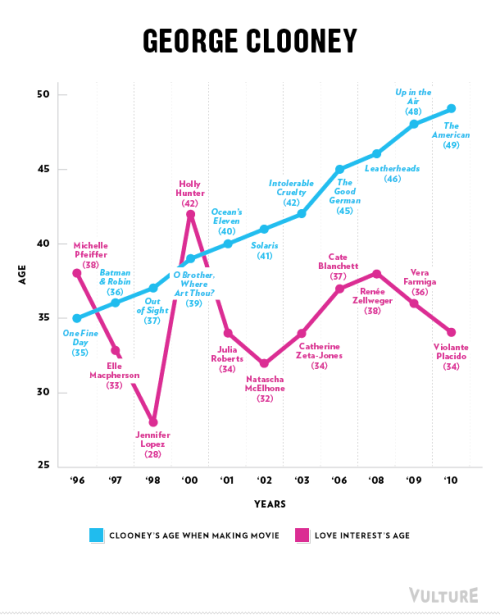
filmography
data visualization
pop culture
hollywood actors
movie trivia
age gap
cinema
celebrity news
there's a rumbly in my tumbly
internet speed
megabits per second
broadband
data visualization
connectivity
technology statistics
network speed
2011 data
country rankings
city rankings
Notational